
The graphical inventory profile in Business Central gives you a visual overview of how an item’s inventory develops over time. You can view the profile per item per location, and filter on location, dimensions, and the types of supply and demand you want to include.
When you run the graphical profile, the tool writes data to a table in Business Central. The table is run per user. Each time you run it, the tool deletes the existing content for your user, recreates the data, and sorts it by date.
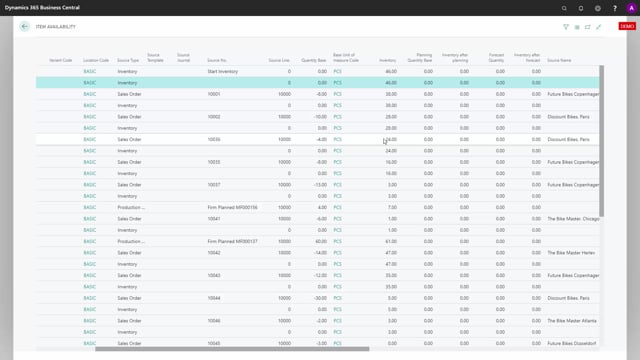
The table includes all supply and demand sources: sales orders, purchase orders, transfer orders, production orders, assembly orders, planning lines, and forecasts. After sorting by date, the tool calculates the inventory level, the inventory level after planning, and the inventory level after forecast.
Because you can filter on the different types of demand and supply, you can decide exactly what to display and see the consequences for inventory in each scenario.
What the graphical inventory profile shows
The tool presents an overview with small dots that mark events over time. When you mouse over a dot, you see the underlying information about supply and demand at that point. This gives you a quick way to understand how inventory moves for a specific item.
You can build a profile for a single item per location, or apply filters on location and dimensions to narrow the view to what you need.
How the profile is calculated in Business Central
Behind the graphical view sits a table in Business Central that holds the base data for the profile. The table runs per user, which you can confirm in the User ID field, where different users appear. If your username is SLO, you filter on that to see the profile you just created.
Every time you run the graphical profile, the tool does three things:
- Deletes the existing data in the table for your user
- Recreates the table with current orders and entries
- Sorts everything by date
The table pulls in all kinds of supply and demand, including sales orders, purchase orders, transfer orders, production orders, assembly orders, planning lines, and forecasts. After sorting by date, it calculates three values: the inventory level, the inventory level after planning, and the inventory level after forecast.
Filtering on supply and demand
The strength of the tool is the filtering. You can filter on all kinds of demand and supply, so you control exactly what the profile shows. This lets you test different scenarios and see how each type of supply or demand affects your inventory level.
Q&A
What is the graphical inventory profile in Business Central?
It is a tool that shows a visual profile of how an item’s inventory develops over time. You can view it per item per location and filter on location, dimensions, and the types of supply and demand you want to include.
Where does the graphical inventory profile store its data?
It writes to a table in Business Central. The table runs per user, so each user has their own profile data, identified by the User ID field.
What happens each time you run the graphical profile?
The tool deletes the existing data in the table for your user, recreates it with current orders and entries, and sorts everything by date.
Which supply and demand sources are included in the profile?
The profile includes sales orders, purchase orders, transfer orders, production orders, assembly orders, planning lines, and forecasts.
What values does the tool calculate?
After sorting the data by date, it calculates the inventory level, the inventory level after planning, and the inventory level after forecast.