
Balancing inventory value against service level is one of the classic conflicts in supply chain management. As a CFO, you want to lower the inventory value and reduce the capital tied up in stock. As a sales officer, you want to raise the service level so you can always deliver. The graphical inventory profile gives you a concrete tool for having that discussion based on real data instead of gut feeling.
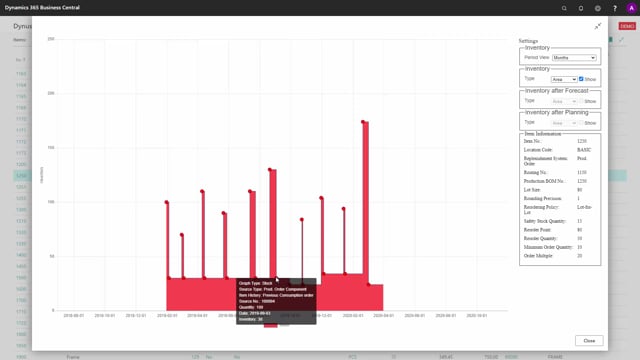
The inventory profile shows you the inventory level over time for individual items, including history. You use it to evaluate whether your safety stock and reordering parameters are set correctly. The colored area below the graph reflects your average inventory value, so you can see directly what a change in safety stock would mean.
For stable items where the inventory never drops close to zero, you can lower the safety stock and free up capital. For items that have run out or nearly run out, you should keep or raise the safety stock to protect the service level. Items further down in the item hierarchy, closer to purchased items, tend to show more stable profiles because a single purchased item feeds into many production items.
The conflict between inventory value and service level
The tension is built into supply chain management. The finance side wants to lower the inventory value and reduce inventory bindings. The sales side wants to raise the service level so the company can deliver on time. Both are right, and the graphical inventory profile gives you a shared basis for deciding where to land.
What the graphical inventory profile shows
The profile lets you view the inventory level for different items over time, including history. That history is what makes the discussion useful. When you sit down to update your planning parameters and items, you can look back and see how the item actually behaved instead of arguing from memory.
The colored area below the graph reflects your inventory value, or your average inventory level. That makes it easy to see the financial effect of adjusting a parameter. Lower the safety stock and the area shrinks, which means less capital tied up in stock.
Reading different item profiles
The right decision depends on the item, and the profile makes the difference visible.
Item 1000 shows a period where the inventory dropped to only one unit, and there was even a situation where it was not possible to deliver. For an item like this, the sales officer has a strong argument to raise the safety stock, or at least keep it where it is.
The next item is also an expensive top-level item, but its lowest point over a two-year period is 10 units. Since it stays more or less stable, you could discuss lowering the safety stock level to 2 or 3 and still be safe.
Further down the item hierarchy, closer to purchased items, the profile often changes. A purchased item can go into many production items, which tends to make its consumption more stable. For one such item the lowest inventory is 24 and it never seems to get below that, so you can lower the safety stock and free up the capital that would otherwise sit unused.
A clearly bad item shows a very high safety stock that can be lowered without risk.
Using the profile to adjust reordering parameters
The profile also helps you evaluate how you replenish each item. You can see how many supplies and demands you have and ask whether you should have fewer supplies. Is it okay that you order this item as often as you do? Would it be better to have higher peaks and fewer supplies?
Used this way, the inventory profile gives you good input for discussing your reordering parameters, so you can affect both your service level and your inventory bindings with your eyes open.
Q&A
What does the graphical inventory profile show?
It shows the inventory level for individual items over time, including history. The colored area below the graph reflects your average inventory value, so you can see the financial effect of changing a parameter.
How do you decide whether to raise or lower the safety stock for an item?
Look at the item’s lowest inventory point over the period. If the item has run out or nearly run out, raise or keep the safety stock to protect the service level. If the item stays stable and never drops near zero, you can lower the safety stock and free up capital.
Why are purchased items often more stable than production items?
A single purchased item can feed into many production items, which smooths out its consumption and makes the inventory profile more stable. That often lets you lower the safety stock on purchased items.
What is the conflict between CFO and sales priorities in inventory management?
The CFO wants to lower the inventory value and reduce capital tied up in stock. The sales officer wants to raise the service level so the company can always deliver. The graphical inventory profile gives both sides a shared, data-based view for deciding where to set the parameters.