
The graphical inventory profile in Business Central gives you a visual overview of your stock development over time. One of the most useful features is the mouse-over text on each data point. When you hover over a dot in the profile, you get the exact details behind it: the source document, the quantity, the due date, and the resulting inventory level after that movement.
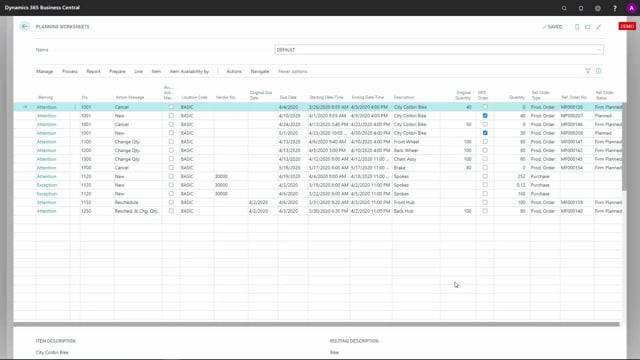
You can run the graphical inventory profile from the planning worksheet. This gives you the most complete picture because you can include both forecast and planning lines alongside your existing inventory and documents.
The profile uses three colours. The red profile shows existing inventory and documents. The blue profile shows forecast. The green profile shows the stock after planning. Each colour has its own mouse-over information.
If the profile gets too crowded with data points, you can hide some of the views. You can choose to display only the actual documents, or only the inventory, or filter to focus on the part you are working with.
Reading the red profile: existing inventory and documents
The red profile represents your existing inventory and your existing documents. The first dot represents the inventory itself. It shows the inventory level on the day before you run the profile, which is the first date in the view.
This first dot sums up everything that happened before the start date. If you run the profile from the 1st of February but you have sales orders dated before that, those orders are not displayed as separate dots because they fall before the starting date. Instead, they are summed up and labelled in the source number as previous sales order demand.
After the start date, each demand appears as its own dot. A demand could be a sales order, a production component line, an assembly component line, or an outbound transfer order. For each one you can see the source number, the quantity, the outstanding quantity on the document, the due date of the document, and the inventory after the impact of that movement.
Supplies work the same way. If you have a production order, the mouse-over shows the source number, whether it is a firm planned or released production order, the order number, the quantity, the due date, and the inventory after the impact. Whatever dot you hover over, you always see the resulting inventory after that specific movement.
Reading the blue profile: forecast
When you hover over a dot in the blue forecast profile, you see only the remaining sales forecast or the remaining component forecast. The quantity displayed is the remaining forecast quantity, which is what an MRP batch job would act on.
The forecast is consumed by actual orders. If you have a forecast quantity of 8 and then place a sales order for 5 after that date, the remaining forecast quantity drops to 3. The mouse-over also shows the date and the inventory after the impact of the forecast.
Reading the green profile: stock after planning
The green dots show the stock after planning. Each green dot refers to a planning line. The mouse-over shows the source number that the planning line wants to act on. If it is a new order, the planning line links to a new order; in other cases it may cancel an existing line.
You also see the quantity the planning line wants to withdraw from or add to inventory, the date, and the resulting inventory after planning on that day. A planning line that adds a surplus to inventory shows up as a positive quantity here.
Q&A
What does the first dot in the red inventory profile show?
It shows the inventory on the day before you run the profile, which is the first date in the view. It sums up all entries dated before the start date, including any earlier sales orders that are not displayed as separate dots.
What information appears when you hover over a document in the inventory profile?
You see the source number, the quantity, the outstanding quantity on the document, the due date, and the inventory level after the impact of that movement.
What does the blue profile in the graphical inventory profile represent?
The blue profile shows forecast. The mouse-over displays the remaining sales forecast or remaining component forecast, which is the quantity an MRP batch job would act on.
Why does my forecast quantity decrease in the profile?
Forecast is consumed by actual orders. If you have a forecast of 8 and place a sales order for 5 after that date, the remaining forecast quantity shown is 3.
What do the green dots in the inventory profile mean?
The green dots show the stock after planning. Each green dot refers to a planning line and shows the source number, the quantity to add or withdraw, the date, and the resulting inventory after planning.
How do I make the graphical inventory profile less cluttered?
You can hide some of the views. For example, you can display only the actual documents or only the inventory instead of showing forecast, planning, and documents at the same time.