
The Graphical Inventory Profile is a tool that can show you a profile for an item per location, or with filter on location and dimensions, etc.
Let me just show you how it actually works. So the user will get an overview like this, with small dots where you can mouse over and see all information about supply and demands. What happens in real life is this. It will write to a table in Business Central.
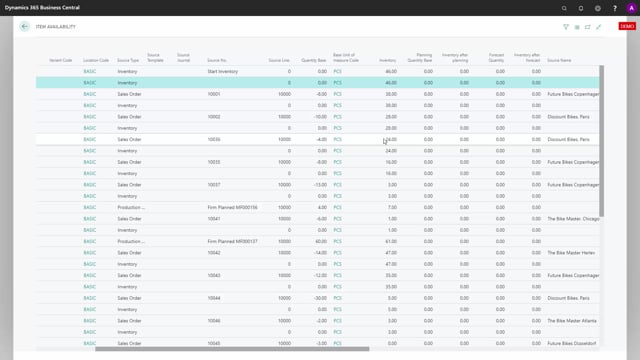
I’ll just show you this table so you can see it. As you can see on the User ID field, we have different users, so this table is run per user. My username is SLO. So if I filter on that, this is the profile that it just created.
So every time I run the graphical profile, it deletes what is in this table, then it recreates the table and sorts it per date, so it enters sales orders, purchase orders, transfer orders, production orders, assembly orders, all kinds of supplies and demands, even planning lines, forecasts, etc. And then after sorting it per date, it will calculate the inventory, the inventory level after planning, and the inventory level after forecast. And those are actually the base information beneath this tool that is calculated each time you run the graphical profile.
So it’s like a simple profile overview, and the good thing is that you can filter on all kinds of demand and supplies, so you can determine what you exactly want to see and what the consequences for the inventory is.