
The item card in Business Central contains a number of actions that are particularly relevant for the finance department. Most of them connect to the fields on the cost and posting tabs, and they help you understand how item values are calculated and tracked. Here is a walkthrough of the actions you will use most often.
Item ledger entries and value entries
Under the Navigate tab you find the History group. The first thing you can open here is the item ledger entries, which show all the inventory movements for the item along with the amounts on each entry.
The amounts are made up by value entries. To one item ledger entry, you can have one or more value entries. You can open the value entries directly from a specific item ledger entry. This structure makes it possible to have different dates on the movements belonging to a single item ledger entry, which matters when costs are posted at a different time than the physical movement.
The application worksheet
Also under History you find the application worksheet. Here you can see how the different item ledger entries are applied to each other. If you need a different application, you can change it directly in the worksheet and apply the entries the way you want.
Default dimensions on the item
On the Item action in the Navigate tab you can add default dimensions to the item. If you work with dimensions in Business Central, you can set up specific dimension values that apply automatically when the item is used in journals or documents.
These item dimensions combine with the dimension setup from vendors and customers when the document relates to purchases or sales, so the final dimension values reflect both sources.
Item statistics on the Availability tab
On the Availability tab you find the Statistics group with three different actions.
The first is the Statistics action, which opens a matrix. You can set up the parameters yourself, including which period you want to see. In this example it displays a three-year period broken down by month. When you run the matrix, you see all the figures for the item, such as sales and cost of goods sold. You can view the figures per month, per day or in another period of your choosing. This is the overall, flexible item statistics view.
The second view is the entry statistics. This is a simpler report that shows the most recent statistics together with what is going to be posted, meaning all the open documents. It is quicker to read, but it is not flexible in the setup the way the matrix is.
The third action is the turnover for the item. Here you can again define the period, whether per day, month, quarter or something else, and see the purchases, sales and quantities for the item.
Many of these statistics views can be exported to Excel if you want to work with the data there.
Cost share and the cost structure
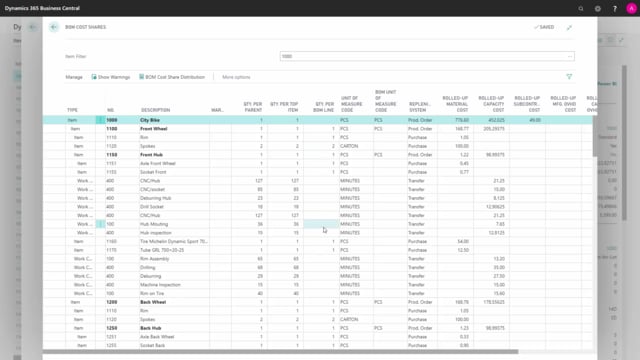
Under Bill of Materials in the Navigate tab you find the Cost Share, which is relevant for finance. It displays the cost structure for the item, depending on whether it is a production item or an assembly item.
The standard cost is built up through the bill of materials. In the cost share you can see the quantities, the unit of measure codes and the figures, including where they come from on production orders. On the left-hand side you see the hierarchy of items going into the item, and if you scroll right you can see how the total cost is made up of the different elements, split into rolled-up material cost, capacity cost and overhead cost. It gives a clear view of how the item cost is composed.
Calculating standard cost for assembly and production items
On the Bill of Materials you also find the Assembly and Production actions.
On the Assembly action you can calculate the standard cost if the item is an assembly item, and you can calculate a unit price for the item based on the profit percentage.
On the Production action you can calculate the standard cost if the item is a production item.
Whether an item is a production item or an assembly item is defined further down on the item card on the replenishment system. That setting determines which of these two actions you use to calculate the cost.
Q&A
What is the difference between item ledger entries and value entries in Business Central?
Item ledger entries record the inventory movements and quantities for an item. Value entries record the amounts behind those movements. One item ledger entry can have one or more value entries, which makes it possible to post costs on different dates than the physical movement.
How do I change how item ledger entries are applied to each other?
Use the application worksheet, found under the History group on the Navigate tab. It shows how item ledger entries are applied to each other, and you can change the applications there if you want to apply entries differently.
What is the difference between the statistics matrix and the entry statistics?
The statistics matrix is fully flexible. You set the parameters and the period yourself, for example a three-year view by month showing sales and cost of goods sold. The entry statistics is a simpler view that shows the most recent statistics and what is going to be posted from open documents, but it is not flexible in its setup.
How are default dimensions on an item handled when used in a sales or purchase document?
The default dimensions set up on the item combine with the dimension setup from the customer or vendor on the document, so the resulting dimension values reflect both the item and the trading partner.
How do I calculate the standard cost for an assembly item versus a production item?
Use the Assembly action on the bill of materials to calculate the standard cost for an assembly item, where you can also calculate a unit price based on the profit percentage. Use the Production action to calculate the standard cost for a production item. Whether the item is an assembly or production item is defined on the replenishment system field on the item card.