
The flexible forecast line in Business Central lets you add a large number of columns, but you rarely need all of them on screen at once. Showing every column makes the view too complex to work with. Pick the columns that match how you actually plan.
If you want to analyse data in Excel, you can calculate everything in the flexible forecast and extract it. If you keep the number of columns manageable, you can work directly in Business Central instead.
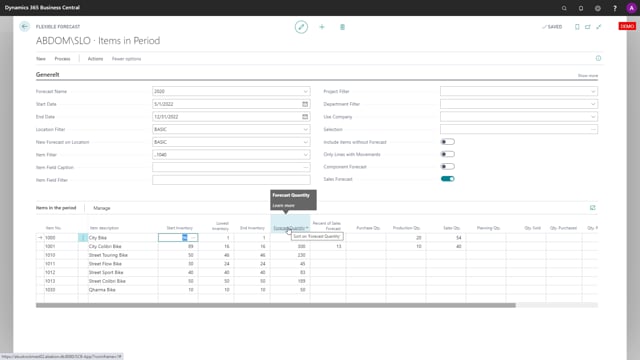
A practical default order starts with start inventory, lowest inventory in the period, and inventory in the period, followed by forecast quantity. From there you add sales, supply, demand, and historical figures. Most columns let you drill down to the underlying values to investigate where a number comes from.
Arranging columns in the flexible forecast line
Arrange the columns in an order that makes sense for your planning process. The order below is a suggested default that follows the logical flow from inventory through demand and supply.
Start with the inventory columns:
- Start inventory
- Lowest inventory in the period
- Inventory in the period
Next comes the forecast quantity, which is the actual quantity you want to maintain, and the percentage of sales forecast, which shows how much you sold compared to your forecast quantity.
Sales, supply, and demand columns
After the forecast, add the columns that show open orders and movements:
- Sold quantity and open sales orders
- Supply: purchase quantity, production quantity, planning quantity
- Demand: sales quantity
- Production order component quantity
Then add the historical figures, so you can see quantity sold, purchased, produced, and consumed over time.
Creating sales and supply orders directly from the line
If you create sales orders and supply orders directly in the flexible forecast, add two action columns on the right-hand side:
- Quantity to sell, where you can create sales orders automatically
- Quantity to order, where you can add supply orders
The quantity to order column is available if you have the Reverse Planning app installed on top of the Flexible Forecast app.
Drilling down to underlying values
In most of the columns you can drill down to the underlying fields or quantities. This lets you investigate the values behind a figure instead of taking the totals at face value.
Q&A
Why shouldn’t you display all columns in the flexible forecast line?
The flexible forecast line supports a large number of columns, but showing all of them makes the view too complex to work with in Business Central. Display only the columns that match your planning process. If you need everything, extract the data to Excel instead.
What columns should you start with in the flexible forecast?
A practical default starts with start inventory, lowest inventory in the period, and inventory in the period, followed by the forecast quantity and the percentage of sales forecast. From there you add sales, supply, demand, and historical columns.
How do you create sales orders and supply orders from the flexible forecast line?
Add the quantity to sell column to create sales orders automatically, and add the quantity to order column to create supply orders. The quantity to order column requires the Reverse Planning app on top of the Flexible Forecast app.
Can you see the values behind a forecast figure?
Yes. Most columns let you drill down to the underlying fields or quantities so you can investigate where a number comes from.