
The flexible forecast in Business Central lets you expand the view per event so you can see exactly what happens and when. Instead of looking at aggregated monthly figures, you can unfold sales orders, sales quantities, and production quantities into the specific dates where they occur.
You unfold the figures by selecting the relevant columns under “Show more” in the header and then refreshing the forecast. You can unfold sales quantity, quantity sold, and production quantity independently, or check all of them at once to get one line per date where something happens.
When you unfold everything, the forecast behaves like an item availability per period view. The difference is that it also calculates the remaining forecast into all the figures, and you can export the result to Excel.
Expanding the flexible forecast per event
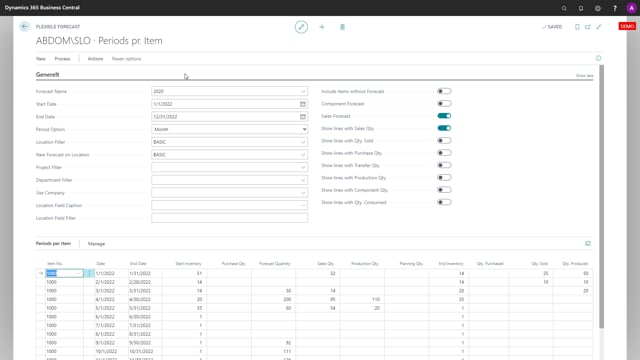
The flexible forecast gives you the option to expand the view per event. If you want to see exactly what is happening and when, you can open the forecast per period. This is the default view, so when you update it, the figures appear straight away.
As an example, in January you might have a sales quantity of 32 and a produced quantity of 50. In April you might have a production quantity of 110, and so on across the periods. At this level, each month shows the totals for that period.
Unfolding sales orders to see individual dates
If you select to show sales quantity in the header, the open sales orders are split out instead of being shown as a single monthly figure. So a January total of 32 or a figure of 14 can be broken down into the underlying sales orders.
When you update the forecast after doing this, the forecast period still starts on the first of the month for the complete period. If you have a forecast quantity, it stays on the period, for example in March. The sales orders, however, are unfolded within the period.
That means you can see, for instance, three separate sales orders with quantities of four, eight, and 20. If several sales orders fall on the same date, they each appear, and you can follow how the inventory evolves through that specific period.
Keeping some figures on the baseline
You decide which figures to unfold and which to keep aggregated. When you unfold the sales quantity, the quantity sold can stay on the baseline at the monthly level. The produced quantity and the production quantity can also remain on a single line for the full period.
Unfolding production quantity
You can unfold production quantity as well by selecting it in the header. When you update the forecast and scroll down, the production quantity appears on the actual dates, for example April 4th and April 24th. You can then see how your inventory develops within that specific period.
Getting a full overview of inventory development
If you want an explicit overview of all your inventory, you can check all of the options in the header and refresh the page. You then get one line per date where something happens, similar to the item availability per period view.
The difference is that this calculation also includes the remaining forecast in all the figures. You can export the whole thing to Excel and use it however you need. This way you can unfold the data and follow exactly how your inventory develops over time.
Q&A
What does it mean to expand the flexible forecast per event?
Expanding per event breaks the monthly totals down into the individual dates where sales orders or production happen. Instead of seeing one aggregated figure for a month, you see each transaction on its actual date and how the inventory develops between them.
How do you unfold sales orders in the flexible forecast?
Select sales quantity under “Show more” in the header and update the forecast. The open sales orders are then split out, so you can see each individual order with its quantity and date instead of a single monthly figure.
Can you unfold production quantity and sales orders separately?
Yes. You choose which figures to unfold. You can unfold sales quantity while keeping quantity sold and production quantity on the monthly baseline, or unfold production quantity by selecting it in the header.
How do you get a complete overview of inventory development by date?
Check all the options in the header and refresh the page. You then get one line per date where something happens, similar to the item availability per period view, with the remaining forecast included in the figures.
Can you export the flexible forecast to Excel?
Yes. The calculation, including the remaining forecast, can be exported to Excel so you can work with the figures however you need.