
When you work with demand forecasting in Business Central, you can export your forecast to Excel and build a new forecast on top of historical data. This makes it possible to base your planning on actual sales figures rather than starting from scratch every time.
You can choose to base a new forecast on last year’s sales, your current forecast, or last year’s forecast. If you select last year’s sales, the suggested forecast is calculated directly from what you actually sold in the same period last year.
You can adjust the numbers using a forecast factor. If you multiply by 1.5, the new forecast becomes one and a half times last year’s sales. This lets you scale your forecast up or down based on expected growth or decline.
Exporting a forecast to Excel
When you export a forecast to Excel, you get the option to choose which data the new forecast should be based on. The three options are:
- Last year’s sales – the new forecast is based on the quantities you sold in the same period last year.
- Current forecast – the new forecast is based on the forecast you already have in place.
- Last year’s forecast – the new forecast is based on the forecast you made for last year.
How the Excel sheet is structured
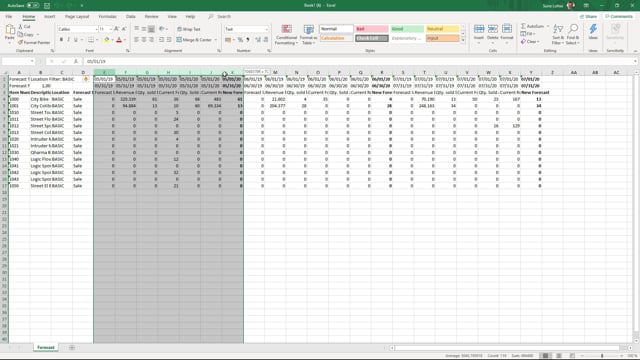
Once you open the Excel sheet, you see the columns for each period. If you selected last year’s sales as your basis, the new forecast area is built on the quantity sold last year for that period.
This gives you a clear starting point for each period, with the historical figures sitting right next to the new forecast you are building.
Adjusting the forecast with a forecast factor
At the top of the sheet you have a forecast factor that you can use to scale the numbers. If you multiply by 1.5, the new forecast is calculated as one and a half times last year’s sales for each period.
This makes it quick to apply an overall growth or reduction assumption across the whole forecast without changing each number by hand.
Basing forecasts on different columns
Because you can choose between last year’s sales, the current forecast, and last year’s forecast, you can base a new forecast on whichever column fits your planning situation best. That flexibility lets you reuse the data you already have and adapt your forecasting approach as your needs change.
Q&A
What can you base a new forecast on when exporting to Excel?
You can base a new forecast on last year’s sales, your current forecast, or last year’s forecast. You choose the basis when you export the forecast to Excel.
What happens if you select last year’s sales as the basis?
The new suggested forecast is calculated from the quantities you actually sold in the same period last year.
How does the forecast factor work?
The forecast factor scales the numbers in your forecast. If you multiply by 1.5, the new forecast becomes one and a half times last year’s sales for each period.