
In Business Central, the chart of accounts is the core of all your financial processes. It is where you control how your finances are structured and where everything gets posted. This article walks through how the chart of accounts is set up, what the different account types do, how dates and filtering work, and how you navigate from a posting all the way back to its source document.
The four account types are posting, heading, total, and begin-total/end-total. Posting accounts are the only ones you can post entries on. Begin-total and end-total accounts mark a range and automatically calculate the sum of the posting accounts between them. A totaling account lets you define a custom account interval to sum up, for example a gross profit account.
The net change column shows postings within your current filter interval, while the balance column shows the total. When you apply a date filter, net change reflects that period while balance still shows the full total.
The document number ties everything together in Business Central. From a single G/L entry you can navigate to all related entries across production orders, item ledger, value entries, and capacity ledger entries.
The four account types in the chart of accounts
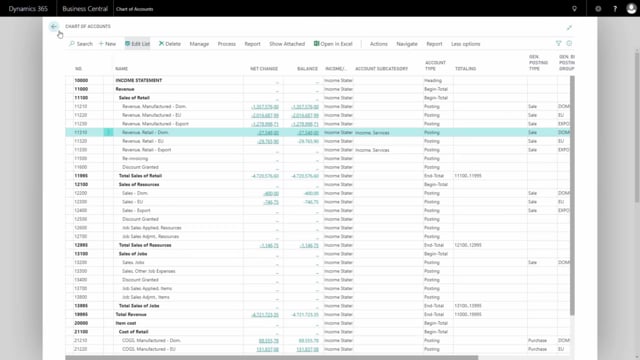
When you open the chart of accounts, you get a list of all the accounts that are set up. If you edit the list, you can see the account type on each line, and the type determines how the account behaves.
- Posting – an account you can post entries on.
- Heading – used purely for grouping data, for example the income statement heading at the top.
- Total – a totaling account where you manually define which account interval to sum.
- Begin-total and end-total – a pair that marks the start and end of a group. You cannot post on these.
If you filter on all accounts starting with the number one, you get a limited overview that makes the structure easier to read. For example, “Sales of retail” is a begin-total, and “Total of retail” is the matching end-total. The end-total line is automatically calculated as the sum of the net change and balance of everything between the two.
The groupings can also nest. “Revenue” can be a begin-total that contains “Sales of retail” inside it, and “Total revenue” then sums all the posting accounts in that larger range. The partial begin-totals and end-totals are sections within that bigger group.
How totaling accounts work
A totaling account works differently from a begin-total/end-total pair. With a totaling account, such as a gross profit account, you manually enter the account totaling. For example, you can set it to start from account 11000 and end at the last account, and only the posting accounts in that interval are included in the calculation. This lets you build custom subtotals across the chart of accounts.
Net change, balance, and date filtering
The net change column displays the postings within a specific filter interval, and the balance column displays the total. If you have not added a date filter, the two columns show the same value.
When you add a date filter using “Filter totals by date” and select, for example, everything from 2018, the net change column shows only what happened in 2018, while the balance column still shows the running total. The same logic applies to other flow field filters. The net change reflects what is inside the filter, and the balance reflects the total.
You can see this when you drill down. Open the net change and you get only the entries inside the filter. Drill into the balance and you get everything posted on the account.
Setting up a G/L account card
Each account has its own setup on the G/L account card. The most important fields are:
- Account number – determines the placement of the account in the hierarchy.
- Description – the name of the account.
- Income statement or balance sheet – has to fit into your hierarchy in the chart of accounts.
- Account category and subcategory – used for reporting. Once you select a category, you can pick from the subcategories that are set up.
- Reconciliation account – a checkmark you select or deselect.
- Direct posting – determines whether you can post directly on the account in journals, or only indirectly through documents.
Using reconciliation accounts in journals
The reconciliation account checkmark lets you preview account totals from different journals before you post. For example, in a payment journal where you are about to receive payments from two customers and make a payment to a vendor, you can scroll to see the amounts and the balance account.
If those accounts are set up as reconciliation accounts, you can click “Bank and reconcile” from the payment journal, or from a normal G/L journal. There you see all accounts that have a checkmark in reconciliation, with the net change in that specific journal per account and the balance you will have after posting. So you can see exactly what the balance on your bank accounts will be before you commit the posting.
Default posting setup on the account
On the posting tab of the account card, you can set up default selections. You do not have to fill them out, but they help create default postings when you enter journal lines manually in G/L journals, purchase journals, or sales journals. Normally this information comes from customers, vendors, items, or resources, but it can also come directly from the G/L account.
The fields you can set up here include the general posting type, the general business posting group, the general product posting group, and the related VAT posting groups.
- The general business posting group normally reflects who you are buying from or selling to, and often where it comes from. It is both a matter of location and a matter of the customer or vendor.
- The general product posting group reflects what you are buying or selling, meaning items or resources.
The combination of business posting group and product posting group determines which account is used. This is all defined in the general posting setup.
How the general posting setup determines accounts
In the general posting setup, the first two columns are the combination of the general business posting group and the general product posting group. Depending on the combination, the system determines which account to post to on purchase documents, sales documents, or directly in the journal.
The accounts in the general posting setup are grouped, with the sales accounts first, the relevant purchase accounts next, and the inventory accounts at the end. When you create a sales journal line to a specific vendor, these accounts determine where the different amounts go. This setup is complex to maintain, and the same applies to the VAT posting setup.
Deferral templates on accounts
The default deferral template field on the G/L account card lets you set up a deferral code, for example to spread a posting over three months or twelve months. When you post in a journal on an account that has a deferral template code, one line is split into the different periods according to the template you set up.
Navigating from an account to its source entries
From the account card you have several navigation options. Through the account functions you can open the ledger entries and see all entries on that specific account, with amounts and full information. You can also open this directly from the chart of accounts.
There is a default filter on the G/L account when you come from a specific account, but you can change it. For example, you can filter on a single document number to see all postings on that document for that account. If you remove the account filter, you see all postings on that document number across all accounts, which can be a lot.
Tracing a document number across the system
From any entry you can use the navigate function to see every posting tied to a document number. This is how the document number binds everything together in Business Central. Every time you post something, the document number connects all the related entries.
For example, navigating from an inventory posting on a raw material account, you can see that the related entries come from a production order. From there you can open the production order and dig deeper. In one example you can see:
- 54 G/L entries.
- Item ledger entries, showing the consumption and output, which is the item impact of the posting.
- Value entries, covering both direct cost and indirect cost, related to the item ledger and capacity ledger.
- Capacity ledger entries from the production.
This lets you follow a posting all the way back to where it originated.
Exporting account entries to Excel
You can open any view in Excel by exporting it directly from the entries. The export respects the filter you have applied in the view. So if you have filtered on a document number rather than an account number, the Excel export reflects that. From there you can use the data for all kinds of reporting.
Q&A
What are the account types in the Business Central chart of accounts?
There are four account types: posting, heading, total, and begin-total/end-total. Posting accounts are the only ones you can post entries on. Headings are for grouping. Totaling accounts sum a manually defined account interval. Begin-total and end-total accounts mark a range and automatically calculate the sum of the posting accounts between them.
What is the difference between the net change and balance columns?
The net change column shows the postings within your current filter interval, for example a specific date range. The balance column shows the total. Without a date filter, both columns show the same value.
How does a date filter affect the chart of accounts?
When you apply a date filter using “Filter totals by date”, the net change column shows only what happened within that period, while the balance column still shows the full running total.
What does the reconciliation account checkmark do?
It lets you preview account totals from a journal before posting. From the journal you can click “Bank and reconcile” to see the net change per reconciliation account and the balance you will have after posting, so you know what your bank account balances will be.
What is the difference between direct and indirect posting?
The direct posting checkmark determines whether you can post directly on an account in journals. If it is not allowed, you can only do indirect postings, meaning postings that come from documents.
What determines which account a transaction posts to?
The combination of the general business posting group and the general product posting group determines the account, based on the general posting setup. The business posting group reflects who you buy from or sell to, and the product posting group reflects what you buy or sell.
How do you trace a posting back to its source in Business Central?
Use the document number. Every posting shares a document number that binds all related entries together. From an entry you can navigate to see all connected entries, such as the production order, item ledger entries, value entries, and capacity ledger entries.
Can you export account entries to Excel?
Yes. You can export the current view directly to Excel. The export respects the filter you have applied, so it reflects whatever document number or account filter is active in the view.