
Let’s take a look at which fields or which columns are most important to understand when you calculate for critical items.
Basically it’s written from the left-hand side, I would normally say it’s until the column planning quantity.
So, let’s take a short look at those columns.
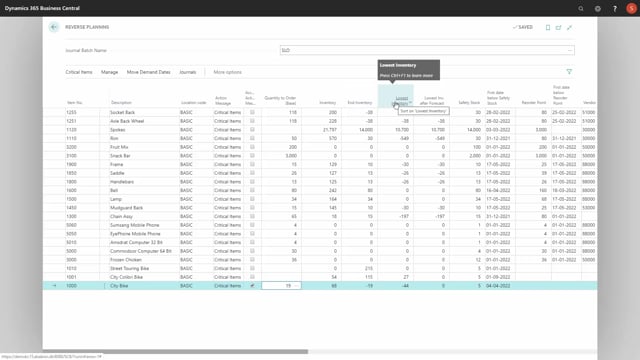
First of all it will display of course the item number that it has calculated as critical, the item description and location code.
Be aware the location code is only filled in if you calculate per location, this means if you look for critical items and you don’t place this checkmark calculate per location, it will be left blank in the column even though you filled it on a specific location.
And this means when you carry out orders, you will carry out orders to location code blank, so, you have to be aware of that.
The action messages will always be a critical item when you calculate for this.
The action message column is the column you checkmark when you want to carry out.
Quantity to order is a field you can enter manually if you want to, or you could calculate it with the function, suggest quantity to order, that we will explain more detailed in another video.
Or you could even look up the functionality to find the information if you have a SKU card or an item card, you can see if there’s a safety stock quantity, reorder point, etc.
Now the inventory, end inventory and lowest inventory column and the lowest inventory after forecast column is filled in, where you can see the inventory is the previous inventory right now, the end inventory is determined by the period you calculate in, and the lowest inventory is determined by the lowest inventory in the period.
You can explain this with the graphical view displaying the 68, minus 19 and minus 44.
So, if we run the graphical profile with the same parameters or the same setup, the figures should be the same, meaning the inventory 68, the lowest inventory minus 44, and the end inventory minus 19.
So, those are all columns to explain why this is a critical item.
The lowest inventory is only calculated if you calculate it with forecast, so, if I’m calculating those amounts here including forecast, I could try that, find critical items, include forecast only for item number 1000 on the same location, the lowest inventory including forecast will be minus 55, and now this amount will also apply to the end inventory, because I selected including forecast, so, this would be my lowest point.
So, the end inventory will include forecast if I have selected include forecast, whereas the lowest inventory is divided into the lowest inventory without forecast and including forecast.
So, this means in my graphical view now, if I look at that again, the minus 44 will be the lowest point on the red graph, and the minus 55 will be the lowest point on the blue graph, which is this scenario is the same as my endpoint.
Safety stock is just an information field, and basically the rest columns are only for information, meaning what is the first day you get below safety stock, and again you can look at the graph to see these numbers.
So, the 4th of April should be the first day below safety stock, and the 9th of April should be the first day below reorder point, and again you could check this on the graph.
Let’s just do it without forecast, and you can see the safety stock bridge here, and you can see the reorder point bridge on the 9th, because there’s no reorder point, so, it’s actually 0, which you can see on the right-hand side as well.
Otherwise it would have been displayed here in the right-hand column.
Then you have the vendor number, that’s used if it’s a purchase item.
The order calculation date is actually used for the move demand date, so, that’s not so, important, but the lead time calculation, replenishment type, quantity on purchase order, quantity on sales order, and planning quantity are all information you can get as a planner to figure out what you want to do with this specific line, especially if you want to handle the quantity to order manually.
So, those are the columns you use when you calculate for critical items.