
Abakion provides standard Excel templates for importing master data through the master data import worksheet in Business Central. These templates use color coding and formatting to tell you exactly how to fill in each field. Red columns are the ones you must fill in. Bold columns require one of the predefined option values, such as a costing method of Standard, FIFO, or Average, written with the correct English caption. Gray columns must match a value in an underlying table, like the base unit of measure defined in your supply chain setup. Italic columns must contain a date formula written in English, such as “6W” for six weeks.
The order of the columns matters. The import worksheet processes data in column order, and some fields validate against others. If you change the column order, you can get unexpected results, because a value entered later may override a value entered earlier.
What the standard import templates contain
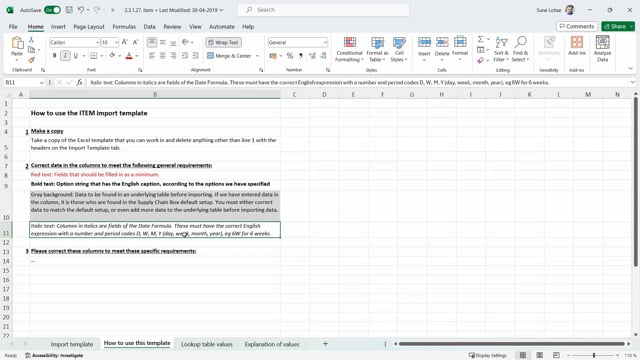
When you import data using the master data import worksheet, Abakion provides a standard template made up of Excel sheets. Each sheet covers a specific table, for example the item import template. The fields in the header are coded with different colors and formatting so you can understand how to set up the data and how the import works.
Each Excel template includes a sheet called “How to use this template” that explains what the formatting means. There is also a tab called “Explanation of values” that shows the standard data behind the relevant table.
Red columns are the fields you must fill in
Fields with red text are the ones you need to fill in for the template. For the item table, these are the red columns. They contain the data the import expects from you.
Bold columns require a predefined option value
Bold columns are option strings. An option string is a predefined dropdown list defined by Microsoft that you cannot change. You must enter one of the standard values, and you must use the English caption.
The costing method is a good example. You can set it to Standard, FIFO, Average, and so on, but you cannot use a value outside that list. If the caption does not match exactly, the import will not apply the value correctly.
Gray columns must match an underlying table
A gray background means the data must already exist in an underlying table before you import. If you use the Abakion default setup, these values are predefined for you in the supply chain setup. Otherwise you have to build them yourself.
The base unit of measure is a typical example. The list of base units you use in the sheet must match the units in the underlying table. If you write “each” in the sheet but it does not exist in the underlying table, the value will not apply when you import.
Italic columns must contain a date formula
Fields shown in italic are date formula fields. You have to write them correctly and in English, using days, weeks, months, or years. For example, write “6W” for six weeks.
The lead time calculation field is an italic field. You have to enter it as a correct date formula for the import to read it.
Why the column order matters in the import
The templates are built with a specific column order, and you should not rearrange the columns. The import worksheet applies data in the column order, and some fields validate against data already entered. Changing the order can produce results you did not intend.
Take the vendor number and the lead time calculation on the item card. In the standard order, the import first enters the vendor number, for example 30000, and then the lead time calculation. The lead time calculation you specified stays in place.
If you change the order and add the lead time calculation first, then add the vendor number afterwards, the import takes the default lead time calculation from the vendor card and overrides the value on the item card, because adding the vendor number triggers validation. So keep the column order as it is delivered.
How the explanation of values tab helps
The “Explanation of values” tab shows the standard data for the table you are working with, for example the item table. It lists the Microsoft-defined dropdown values you cannot change, and it lists the values Abakion suggests, which are the gray columns, such as the standard units of measure.
The tab also shows the lookup table values, so you can see which column each list applies to. For example, the base unit of measure has a dropdown list, and the tab tells you where it is used. It works like a copy of the first sheet, with the addition of which column holds the standard setup.
The simple rule for filling in the template
Fill in the import template in the predefined column order. Complete the red columns. Make sure every gray column has a matching value in the underlying table. Make sure every bold column is written with the correct English caption. Write italic columns as valid date formulas.
Q&A
What do the colors in the Abakion master data import template mean?
Red text marks the columns you must fill in. A gray background means the value must already exist in an underlying table. Bold marks an option string where you must enter a predefined value using the English caption. Italic marks a date formula field.
How do I enter an option field like costing method in the import template?
Option fields are shown in bold. They are predefined dropdown lists defined by Microsoft that you cannot change. Enter one of the standard values, for example Standard, FIFO, or Average, and use the correct English caption.
How do I write a date formula in the import template?
Date formula fields are shown in italic. Write them in English using days, weeks, months, or years, for example “6W” for six weeks. The lead time calculation is one of these fields.
Why should I not change the column order in the import template?
The import worksheet applies data in column order, and some fields validate against data already entered. If you add the vendor number after the lead time calculation, the validation pulls the default lead time calculation from the vendor card and overrides your value on the item card. Keep the column order as delivered.
Where can I see the standard values for an import table?
Open the “Explanation of values” tab in the template. It shows the Microsoft-defined dropdown values, the values Abakion suggests for the gray columns, and which column each lookup list applies to.